


I needed some debug and tracing information on Zephyr RTOS. It was a bit of a struggle, but I did retrieve some useful information, so here is a compilation of my findings about tracing.
Disclaimer: First version for this was written on Zephyr V3.6. I updated the scripts for V4.1. If you are me from the future, check your software version first.
What does it do
Traces only export data from the kernel itself, namely threads, semaphores, and interrupts. It won’t trace functions, so it will mostly be useful for timing debugging, typically getting a view on how much time is spent in idle thread versus work threads.
There is a very useful blog post explaining how to add custom traces to functions, but it is quite heavy work:
https://jonathan.rico.live/blog/2023-11-13/
How to set it up
In my case, I have an ST-Link debugger. There are some more advanced trace options with Segger chips, but I will have to use the most basic features:
- CTF format is Common Trace Files format, a quite crude but efficient way to pack up trace data in a binary file.
- Backend RAM means that the trace will not be sent through UART, or USB, but will be recorded into a RAM buffer. The total size is set by CONFIG_RAM_TRACING_BUFFER_SIZE. I chose the max value I could, 65536. And since we are writing directly to RAM, it should be fast enough to avoid disrupting the program execution.
Tracing is activated in prj.conf:
CONFIG_TRACING=y
CONFIG_TRACING_CTF=y
CONFIG_TRACING_BACKEND_RAM=y
CONFIG_TRACING_BUFFER_SIZE=2048
CONFIG_RAM_TRACING_BUFFER_SIZE=65536
CONFIG_TRACING_SYNC=y
You can also toggle trace types on or off:
CONFIG_TRACING_ISR=n
CONFIG_TRACING_SEMAPHORE=y
After building, you can check the ram buffer was indeed created in build/zephyr/zephyr.map:
 .bss.ram_tracing
    0x0000000020001964     0x1000 zephyr/libzephyr.a
    0x0000000020001964                ram_tracing
How to retrieve your RAM buffer
Well, you will need GDB, and dump the trace with:
(gdb) dump binary memory data/mytrace.ctf ram_tracing ram_tracing+65536But wait, is this buffer circular, how do I know where I am? The answer is: this buffer just records everything since the start of program and stops when the buffer is full. If you need startup data, it’s perfect… but if you don’t, keep reading.
How to choose what to trace
The “buffer full” event is handled in tracing_backend_ram.c:
zephyr/subsys/tracing/tracing_backend_ram.cAt this point, the pos cursor reach its max value and we set buffer full to true.
We can use GDB to force those variables back to pristine state:
(gdb) set variable pos=0
(gdb) set variable buffer_full=0
For instance, to get an infinite buffer retrieval, it is possible to break when buffer is full, download, and reset variables. You need to have a folder called “data” in the path from where you are calling gdb.
(gdb) break tracing_backend_ram.c:27
(gdb) continue
(gdb) dump binary memory data/mytrace.ctf ram_tracing ram_tracing+65536
(gdb) set variable pos=0
(gdb) set variable buffer_full=0
(gdb) continue
Or, it is also possible to break before something interesting happens, reset variables, and break again after the something.
And, since I am ashamed of nothing, I wrote a script for that:
https://github.com/everedero/misc_scripts/blob/main/script.gdb
(gdb) source script.gdbFor complete download:
(gdb) dltraceFor tracing between two points:
(gdb) tracebetween main.c:331 main.c:333Update: In upcoming versions (> 3.6.0) it will be possible to reset the RAM content by calling init().
How to convert traces
CTF to text with babeltrace2
You got yourself a bunch of bytes, awesome. But how to convert it to something useful?
First, fun fact, CTF format is not complete without a “metadata” file which describes the CTF packets formats. In order to decypher the CTF file, it is necessary to put it in the same folder as its metadata file:
data
├── mytrace.ctf
├── metadata
Zephyr provides its metadata file:
cp ~/zephyrproject/zephyr/subsys/tracing/ctf/tsdl/metadata ./dataNow, a parser is required. I chose babeltrace2 to simply convert ctf files to text.
To install babeltrace2:
sudo apt-add-repository ppa:lttng/ppa
sudo apt-get update
sudo apt-get install babeltrace2 libbabeltrace2-dev
To convert the CTF to text:
babeltrace2 convert --component=ctf:source.ctf.fs --params='inputs=["data"]' --component=muxer:filter.utils.muxer --component=pretty:sink.text.pretty > trace.txtThis takes the data folder as input, and converts it from “ctf.fs” to “text.pretty”. Syntax looks like GStreamer CLI, and I have always been scared of GStreamer CLI.
Since we downloaded the full buffer with potential 0-padding or remaining data from previous iteration, babeltrace2 will complain that it cannot parse the end of the file.
02-26 13:36:46.555 24379 24379 E PLUGIN/CTF/MSG-ITER set_current_event_class@msg-iter.c:1276 [ctf] No event class with ID of event class ID to use in stream class: msg-it-addr=0x55bd46d4e850, stream-class-id=0, event-class-id=0, trace-cla
ss-addr=0x55bd46cd1af0
02-26 13:36:46.555 24379 24379 E PLUGIN/CTF/MSG-ITER ctf_msg_iter_get_next_message@msg-iter.c:2897 [ctf] Cannot handle state: msg-it-addr=0x55bd46d4e850, state=AFTER_EVENT_HEADER
02-26 13:36:46.555 24379 24379 E PLUGIN/SRC.CTF.FS ctf_fs_iterator_next_one@fs.c:108 [ctf] Failed to get next message from CTF message iterator.
This is what happens with 0-paddings: stream-class-id=0 and event-class-id=0 suggests that it could only find zeros instead of valid classes defined by the metadata file.
But it works all right, it’s just like me on roller skates: I don’t know how to brake, so I crash into lamp posts instead.
Result
[01:00:02.724926184] (+0.000004238) semaphore_give_enter: { id = 536871028 }
[01:00:02.724930250] (+0.000004066) semaphore_give_exit: { id = 536871028 }
[01:00:02.724935964] (+0.000005714) semaphore_take_enter: { id = 536871028, timeout = 4294967196 }
[01:00:02.724940398] (+0.000004434) semaphore_take_exit: { id = 536871028, timeout = 4294967196, ret = 0 }
[01:00:02.724948363] (+0.000007965) semaphore_take_enter: { id = 536871048, timeout = 200000 }
[01:00:02.724952809] (+0.000004446) semaphore_take_blocking: { id = 536871048, timeout = 200000 }
[01:00:02.724963767] (+0.000010958) isr_enter:
[01:00:02.724971285] (+0.000007518) isr_exit:
[01:00:02.724975517] (+0.000004232) isr_enter:
[01:00:02.724982285] (+0.000006768) isr_exit:
[01:00:02.724986523] (+0.000004238) isr_enter:
[01:00:02.724993285] (+0.000006762) isr_exit:
[01:00:02.724997523] (+0.000004238) isr_enter:
[01:00:02.725006386] (+0.000008863) semaphore_give_enter: { id = 536871048 }
[01:00:02.725014005] (+0.000007619) semaphore_give_exit: { id = 536871048 }
[01:00:02.725018375] (+0.000004370) isr_exit:
[01:00:02.725021857] (+0.000003482) isr_enter:
[01:00:02.725028363] (+0.000006506) semaphore_give_enter: { id = 536871048 }
[01:00:02.725033166] (+0.000004803) semaphore_give_exit: { id = 536871048 }
[01:00:02.725036809] (+0.000003643) isr_exit:
[01:00:02.725042505] (+0.000005696) thread_switched_out: { thread_id = 536871360, name = "main" }
[01:00:02.725052303] (+0.000009798) thread_switched_in: { thread_id = 536871360, name = "main" }
[01:00:02.725057720] (+0.000005417) semaphore_take_exit: { id = 536871048, timeout = 200000, ret = 0 }
[01:00:02.725061952] (+0.000004232) semaphore_give_enter: { id = 536871028 }
[01:00:02.725066005] (+0.000004053) semaphore_give_exit: { id = 536871028 }
[01:00:02.725072910] (+0.000006905) semaphore_take_enter: { id = 536871028, timeout = 4294967196 }
[01:00:02.725077351] (+0.000004441) semaphore_take_exit: { id = 536871028, timeout = 4294967196, ret = 0 }
“id” gives you a RAM address, you can use the GDB session to find what lives here:
(gdb) x /1x 536871012
0x20000064 <spi_stm32_dev_data_0+16>:   0x20000064
(gdb) print spi_stm32_dev_data_0
$1 = {ctx = {config = 0x8007d40 <ili9xxx_config_0+8>, owner = 0x0, cs_gpios = 0x8008028 <__compound_literal.0>, num_cs_gpios = 1, lock = {wait_q = {waitq = {{head = 0x20000064 <spi_stm32_dev_data_0+16>, next = 0x20000064 <spi_stm32_dev_data_0+16>}, {tail = 0x20000064 <spi_stm32_dev_data_0+16>, prev = 0x20000064 <spi_stm32_dev_data_0+16>}}}, count = 1, limit = 1, _obj_track_next = 0x0}, sync = {wait_q = {waitq = {{head = 0x20000078 <spi_stm32_dev_data_0+36>, next = 0x20000078 <spi_stm32_dev_data_0+36>}, {tail = 0x20000078 <spi_stm32_dev_data_0+36>, prev = 0x20000078 <spi_stm32_dev_data_0+36>}}}, count = 0, limit = 1, _obj_track_next = 0x0}, sync_status = 0, current_tx = 0x200119b8 <z_main_stack+888>, tx_count = 0, current_rx = 0x0, rx_count = 0, tx_buf = 0x0, tx_len = 0, rx_buf = 0x0, rx_len = 0}}Some of those addresses can also be recovered from the zephyr.map file, here with a semaphore with id=536936612=0x200100a4:
grep -rnw ./build/zephyr/zephyr.map -e "0x.*200100a4"2706:k_sem_area 0x00000000200100a4 0x28 load address 0x0000000008004cfc
2707: 0x00000000200100a4 _k_sem_list_start = .
2710: 0x00000000200100a4 0x14 app/libapp.a(main.c.obj)
2711: 0x00000000200100a4 threadA_semIn-tree CTF parsing script
There is a parsing script in Zephyr directory:
./scripts/tracing/parse_ctf.pyIt is calling BabelTrace2 via its Python bindings. It also has the same “there’s an error, just ignore it” issue.
https://github.com/everedero/zephyr/tree/eve/trace_experiments
python3 ../scripts/tracing/parse_ctf.py -t data > trace.txtResult
Example trace with the sample/subsys/tracing directory, using a custom RAM trace config (prj_ram.conf). It is slightly more readable, but does not show all the fields.
1970-01-01 01:00:00.005947 (+0.000000 s): thread_create: thread_a
1970-01-01 01:00:00.005954 (+0.000007 s): thread_info (Stack size: 2048)
1970-01-01 01:00:00.005977 (+0.000023 s): thread_switched_out: main
1970-01-01 01:00:00.005991 (+0.000013 s): thread_switched_in: thread_a
1970-01-01 01:00:00.006003 (+0.000012 s): thread_create: unknown
1970-01-01 01:00:00.006010 (+0.000007 s): thread_info (Stack size: 2048)
1970-01-01 01:00:00.006024 (+0.000014 s): thread_name_set
1970-01-01 01:00:00.006032 (+0.000008 s): semaphore_take_enter
1970-01-01 01:00:00.006038 (+0.000006 s): semaphore_take_exit
1970-01-01 01:00:00.009628 (+0.003590 s): thread_switched_out: thread_a
1970-01-01 01:00:00.009641 (+0.000013 s): thread_switched_in: thread_b
1970-01-01 01:00:00.009649 (+0.000008 s): semaphore_take_enter
1970-01-01 01:00:00.009656 (+0.000006 s): semaphore_take_blocking
1970-01-01 01:00:00.009668 (+0.000013 s): thread_switched_out: thread_b
1970-01-01 01:00:00.009682 (+0.000013 s): thread_switched_in: idle
1970-01-01 01:00:00.009690 (+0.000008 s): idle
1970-01-01 01:00:00.087132 (+0.077442 s): idle
1970-01-01 01:00:00.164637 (+0.077505 s): idle
[...]
CTF to Google Perfetto CTF
In order to be displayed in Perfetto, traces have to be converted to a specific JSON format.
The ctf2ctf.py converter exists in an unmerged branch here and is also described in the same blog post: https://jonathan.rico.live/blog/2023-11-13/
python3 ctf2ctf.py -t ./data/It ends with a “Trace does not terminate cleanly” message, because of the exact same issue as before, but still outputs an out.json file.
Result
"traceEvents": [{"pid": 0, "tid": 0, "name": "thread_create", "ph": "i", "ts": 5946.912, "args": {"dummy": 0}},
{"pid": 0, "tid": 0, "name": "thread_info", "ph": "i", "ts": 5954.342, "args": {"dummy": 0}},
{"pid": 0, "tid": 536937200, "name": "running", "ph": "E", "ts": 5977.495, "args": {"dummy": 0}},
{"pid": 0, "tid": 536936656, "name": "running", "ph": "B", "ts": 5990.782, "args": {"dummy": 0}},
{"pid": 0, "tid": 0, "name": "thread_create", "ph": "i", "ts": 6003.111, "args": {"dummy": 0}},
{"pid": 0, "tid": 0, "name": "thread_info", "ph": "i", "ts": 6009.976, "args": {"dummy": 0}},
{"pid": 0, "tid": 0, "name": "thread_name_set", "ph": "i", "ts": 6024.296, "args": {"dummy": 0}},
{"pid": 0, "tid": 3, "name": "semaphore_take_enter", "ph": "i", "ts": 6032.236, "args": {"dummy": 0}},
{"pid": 0, "tid": 3, "name": "semaphore_take_exit", "ph": "i", "ts": 6038.069, "args": {"dummy": 0}},
{"pid": 0, "tid": 536936656, "name": "running", "ph": "E", "ts": 9628.083, "args": {"dummy": 0}},
{"pid": 0, "tid": 536936832, "name": "running", "ph": "B", "ts": 9641.314, "args": {"dummy": 0}},
{"pid": 0, "tid": 3, "name": "semaphore_take_enter", "ph": "i", "ts": 9649.462, "args": {"dummy": 0}},
{"pid": 0, "tid": 3, "name": "semaphore_take_blocking", "ph": "i", "ts": 9655.773, "args": {"dummy": 0}},
{"pid": 0, "tid": 536936832, "name": "running", "ph": "E", "ts": 9668.462, "args": {"dummy": 0}},
{"pid": 0, "tid": 536937024, "name": "running", "ph": "B", "ts": 9681.745, "args": {"dummy": 0}},
[...]
Trace GUI
You can also download and use a GUI to visualize the trace.
I tried two options:
- Tracecompass
- Perfetto
Tracecompass
Tracecompass is open-source (EPL V2 license), it is based on Eclipse, hence on Java, except I don’t have the right Java version, oh well.
After a bit of fiddling around, I found a suitable Java for it, and I cannot remember how.
Result
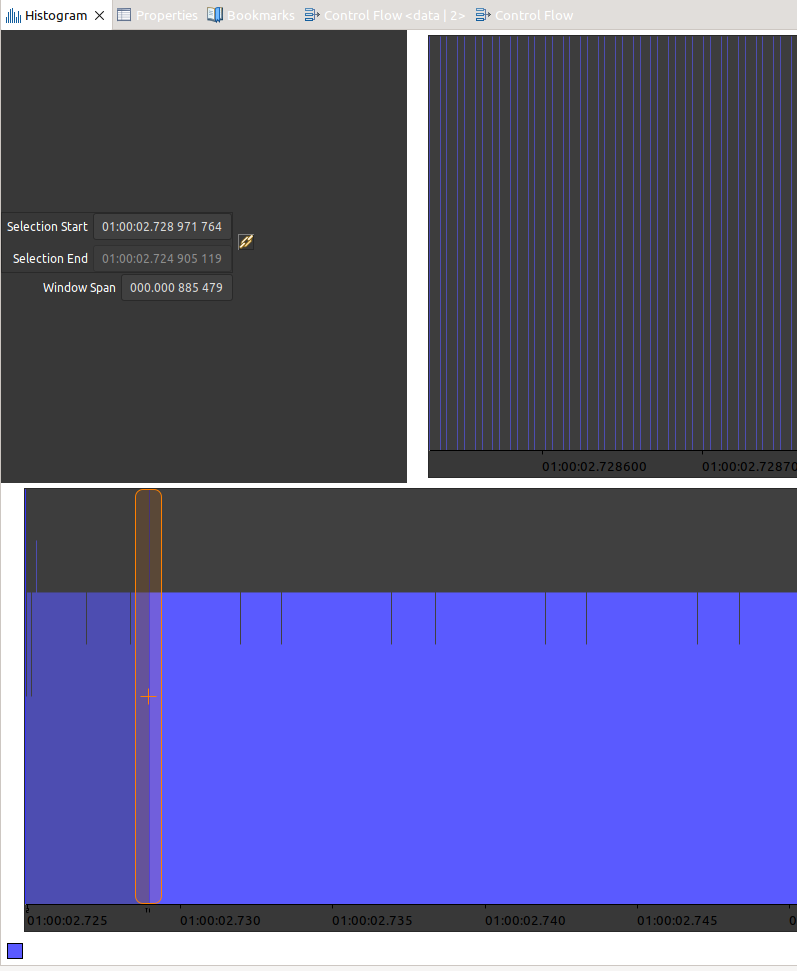
Now, it would need a plugin to display the start and end of an event and create advanced visualizations.
An example of such scripts for FreeRTOS: https://github.com/gpollo/freertos-barectf/tree/master/scripts
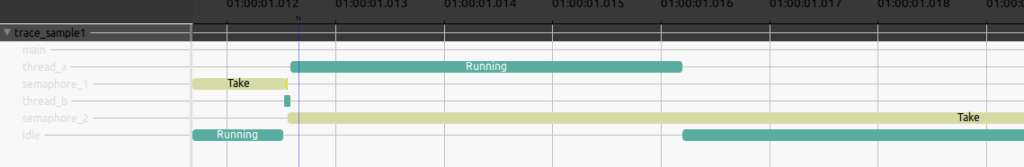
The excellent Guillaume Redero made an update to the parser, you can find it here: Zephyr Tracecompass parser project. This is what it looks like:
Some additional resource about Tracecompass scripting:
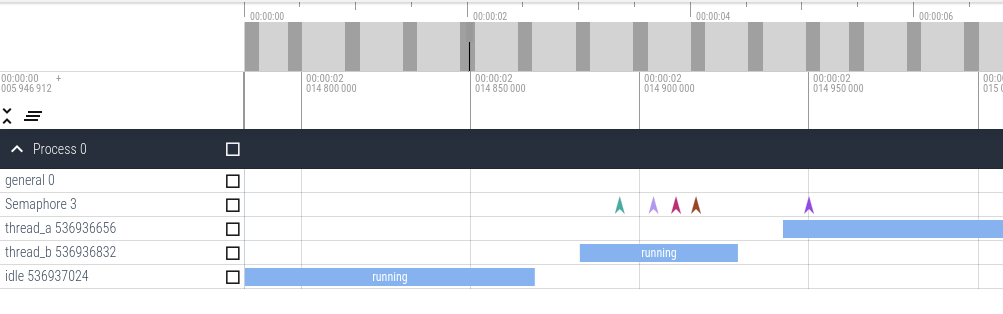
Perfetto
Perfetto is a web-based UI from Google, and it is open-source, with Apache 2.0 license.
The output json file generated by ctf2ctf.py can be opened in https://ui.perfetto.dev:
Conclusion
GDB scripting, binary file formats, GStreamer-like CLIs, Java version issues… there are lots of things I struggled with. But I am glad I made it this far and I can now use some tracing when needed!
And if you have any updates or projects, come find me on zephyrproject Discord channel #tracing.